Printer Friendly Version
Can Hyperscalers Earn Their AI Ambitions?
LPL Research explores whether hyperscalers can generate attractive returns on massive AI investments through a framework focused on ROIC, growth, and capex.
Market context: The first half of 2026 was a tale of two quarters for U.S. equity markets, as the S&P 500 experienced a drawdown of ~4.5% in the first quarter, followed by a ~15% rally in the second quarter. As investors look forward to the second half, the artificial intelligence (AI) trade remains top of mind, much as it has over the last three-plus years.
The capex spotlight: With second quarter (Q2) earnings season well underway, attention is laser-focused on capital expenditure (capex) spending signals from the cloud computing “hyperscalers” driving the majority of spend.
A framework for ROIC: Here, we take a data-driven approach to help frame the debate on the return on invested capital (ROIC) on hyperscaler AI capex, using various scenarios for a hypothetical “average hyperscaler.” We then compare those return profiles to similar return generating businesses, with the end goal being a clear-minded approach to thinking about the hyperscaler business model for long-term investors.
What Does Hyperscaler Capex Have to Earn?
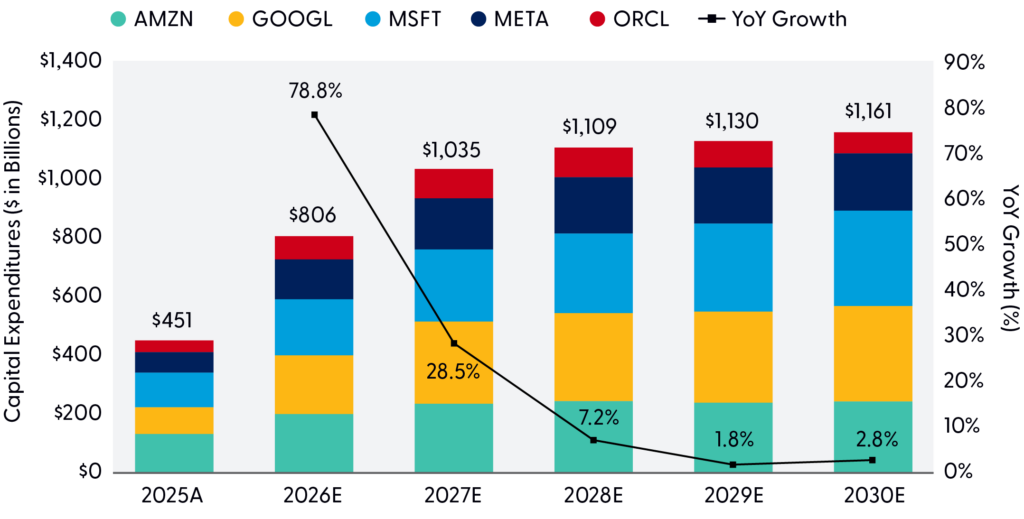
The AI investment cycle has become one of the defining capital allocation questions in public markets. The largest technology companies are spending at a scale that would have seemed implausible only a few years ago. The scale and expected growth of this spending is presented in Exhibit 1, “Historical and Forward Capex Expectations (Consensus).” The market has largely rewarded that spending because the near-term signals imply that cloud growth is accelerating and AI demand is supply constrained.
Exhibit 1: Historical and Forward Capex Expectations (Consensus)
Source: LPL Research, Company Reports, Bloomberg 07/23/26
Disclosures: Past performance is no guarantee of future results. GOOGL 2026 estimate is midpoint of company guidance; MSFT and ORCL data has been converted to calendar year convention.
For investors, the question is not how much capital is being deployed, but whether that capital will earn attractive returns over the life of the assets being built. Rather than make a bullish or bearish call attempting to answer this question, we can build a framework around the three major public hyperscaler cloud businesses (Amazon Web Services, Microsoft Azure, and Google Cloud) to ascertain what an “average hyperscaler cloud business” has to earn on its capital for today’s investment cycle to make sense. Note, we do not include Meta Platforms or Oracle Corp. (ORCL) in our framework, as these companies’ external cloud businesses are not mature enough to provide reliable historical data in our aggregate “average hyperscaler” build.
This discussion, as noted in the latest Beyond the Numbers, focuses primarily on ROIC that a hyperscaler cloud business generates. As a corporate finance refresher, ROIC measures how effectively a company converts the capital invested in the business (both debt and equity) into operating profit. The simple rule is that investments earning ROIC above a company’s weighted-average cost of capital (WACC) create economic value, while investments earning ROIC below WACC destroy value and should generally not be pursued unless there is a credible path to higher future returns or a strategic reason that justifies the near-term value destruction.
The Economics of the “Average Hyperscaler Cloud Business”
To understand the “average hyperscaler,” we must construct a hypothetical aggregate of the cloud computing infrastructure business segments of the three major hyperscalers previously outlined, with some necessary adjustments due to reporting nuances. These segments are just single business lines within larger businesses, and we recognize that each are at slightly different levels of maturity and their revenue is not wholly generated from “AI-compute.” However, much of the traditional non-AI cloud business infrastructure is deeply integrated into the segment’s AI-compute capability that is being heavily invested in today. Thus, we take a best-effort approach to isolate what matters to create an “average hyperscaler” business. Our build begins with calendar year-end 2025 as our baseline, and we define the core building blocks below.
- Revenue
- Amazon Web Services (AWS): Segment revenue as reported
- Google Cloud: Segment revenue as reported
- Microsoft Azure and Other Cloud Services: Implied sub-segment revenue of business that sits within broader “Intelligent Cloud” reported segment; implied via company-provided quarterly growth rates
- Operating Income and Margins
- Amazon Web Services (AWS): Segment operating income as reported
- Google Cloud: Adjusted estimate of operating income that allocates a portion of corporate AI-related R&D expenses to the cloud. We allocate 30% of these to the Google Cloud segment’s operating income.
- Microsoft Azure and Other Cloud Services: Estimated sub-segment operating income based on Azure’s growth profile, which implies a margin for Azure that is less than the total “Intelligent Cloud” segment.
- Capital Expenditures (Capex)
- Amazon Web Services (AWS): Segment-level additions to property, plant, and equipment (PP&E) as reported.
- Google Cloud: Estimated share of total company capex.
- Microsoft Azure and Other Cloud Services: Estimated allocation of total company capex, including capital leases.
- Depreciation of Property, Plant, and Equipment (PP&E)
- Amazon Web Services (AWS): Segment-level depreciation as reported.
- Google Cloud: Estimated share of total company capex allocated to Google Cloud segment.
- Microsoft Azure and Other Cloud Services: Estimated share of total company capex allocated to Azure and Other Cloud Services segment.
- Deployed Infrastructure Asset: Property, Plant, and Equipment (PP&E) + Operating Lease ROU (right-of-use)
- Amazon Web Services (AWS): Segment-level PP&E, net of accumulated depreciation, as reported, plus an estimate of operating lease (ROU) assets for the segment derived from the non-PP&E portion of AWS’ total assets (which is explicitly reported).
- Google Cloud: Alphabet does not explicitly report segment level PP&E or operating leases, but they do separately disclose gross PP&E by type of asset. We estimate a capital base supporting Google Cloud’s hyperscaler business. We add a pro-rata share of operating leases to the asset base.
- Microsoft Azure and Other Cloud Services: Estimated share of total company PP&E and operating lease ROU assets allocated to Azure and Other Cloud Services segment.
From Software Multiples to Infrastructure Math
Our calendar 2025 starting point shows these are very large, very profitable businesses. AWS reported roughly $129 billion for 2025, and Google Cloud reported ~$59 billion for 2025. Microsoft does not disclose Azure revenue directly, but the Intelligent Cloud segment generated ~$120 billion in revenue in calendar 2025. Based on company disclosures and our math, we believe the Azure and other cloud services sub-segment was a ~$90B revenue business, representing roughly 75% of the reported Intelligent Cloud segment. Across the three, cloud infrastructure market share remains concentrated, with AWS, Azure, and Google Cloud estimated at roughly 31%, 24%, and 12% of the global market, respectively, per industry research.
The segment margin story has also improved materially. AWS generated $14.2 billion of operating income in Q1 2026, implying a 37.7% operating margin. Google Cloud’s margin progression has been especially notable, moving from low-single-digit profitability earlier in the cycle to reported margins in the mid-20s to 32% in Q1 2026, though the reported calculation does not include shared AI R&D reported at the corporate level. Microsoft’s Intelligent Cloud segment has historically operated at even higher margins, though it includes more than Azure alone.
The complication is capex. Amazon, Microsoft, and Alphabet collectively spent more than $300 billion on capex at the corporate level in calendar 2025, with anywhere from 60–75% of that total dedicated to AI compute and data center buildouts. The numbers are clearly rising again in 2026, with outside estimates pointing to very large increases across all three companies. By our estimates, combined cloud capex as a percentage of cloud-specific revenue approached the 75–80% range for the three hyperscalers in calendar 2025. These capex-to-sales levels are more commonly associated with infrastructure-heavy industries than traditional software platforms.
The hyperscaler’s cloud businesses still generate software-like margins, but the incremental investment profile increasingly looks infrastructure-like. Therefore, the relevant question becomes should this business be valued like a software platform, infrastructure asset, or something in between?
The Business Drivers That Decide the Return
A useful way to think about the return math is to build a composite cloud ROIC using the previously defined building blocks of our aggregated “average hyperscaler cloud business.” The numerator is relatively straightforward: cloud segment operating income, tax-adjusted into an estimate of net operating profit after tax (NOPAT). The denominator, invested capital, is the “deployed infrastructure asset” base, which includes estimated net PP&E and operating lease ROU assets utilized in the hyperscaler cloud business. Two additional drivers that are particularly important are capital expenditures (which are added to the deployed infrastructure capital asset base as gross PP&E) and depreciation of the capital asset base (which is reported as an operating expense over time, reducing operating income, and is recorded on the balance sheet as accumulated depreciation, thus reducing PP&E over time). Effectively, capex does not immediately reduce operating income dollar-for-dollar. Our approach takes the estimated useful life of the incremental PP&E assets into account, where much of the chips/server equipment has a shorter useful life (and thus larger annual depreciation hit over a shorter period), while buildings and land assets have a longer useful life.
Scenario Analysis: What Has to Be True?
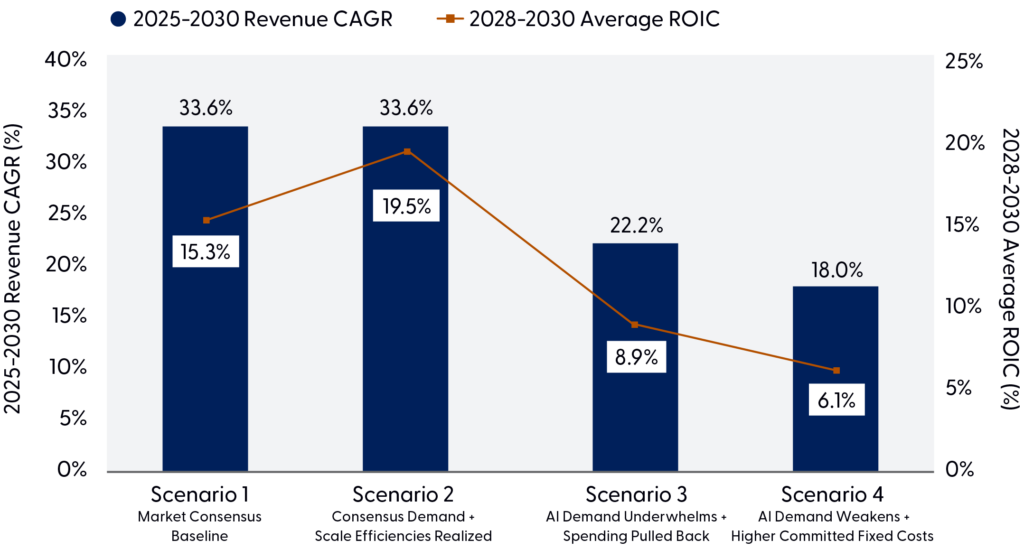
In order to derive a baseline market consensus read on what these returns are currently estimated to be, we first build a calendar year 2025–2030 ROIC composite that aggregates consensus estimates for the core drivers of each cloud business, with necessary adjustments previously outlined. Once we have this baseline, we can create several scenarios that shift the core drivers of ROIC up or down, based on the specific scenario we are modeling. Our scenario analysis included four hypothetical futures over this time: scenario one reflects the consensus baseline; scenario two reflects a more bullish scenario than the consensus baseline that assumes the same revenue growth as scenario one with capital efficiency realizations resulting in lower capex; scenario three reflects a slightly bearish but perhaps more realistic scenario with slower revenue and capex growth; and scenario four reflects a downright bearish scenario with even slower revenue growth without declines in capex. The variation of each scenario’s average 2028–2030 ROIC output, alongside the implied revenue CAGR (compound annual growth rate), can be found in Exhibit 2 “Summary of Hyperscaler ROIC Scenario Analysis.” Please note these are hypothetical scenarios only and not indicative of any particular company, security, or investment. The hypothetical average hyperscaler is a modeled construct developed by LPL Research and does not represent an actual company or investable entity.
Exhibit 2: Summary of Hyperscaler ROIC Scenario Analysis
Source: LPL Research, Company Reports, Bloomberg 07/23/26
Disclosures: Past performance is no guarantee of future results. Hypothetical example for illustrative purposes only. The hypothetical average hyperscaler is a modeled construct developed by LPL Research and does not represent an actual company or investable entity.
Across all four cases, the hypothetical average hyperscaler remains a large and strategically important business; what changes is the appropriate comparable industry and valuation framework as growth, margins, capital intensity, depreciation burden, and ROIC move through the cycle. In upside cases, the business retains enough platform economics to justify a premium to traditional infrastructure, and in the strongest case, begins to resemble software-like infrastructure. In the downside cases, however, the valuation lens shifts materially: first toward high-quality data center/telecom infrastructure, and then, in the most adverse outcome, toward an asset-heavy overbuild framework where replacement value, normalized free cash flow, balance sheet flexibility, and cost of capital matter more than revenue growth alone.
Conclusion
The hyperscaler AI capex cycle is not easily classified as either a bubble or a straightforward software growth story. The more useful framing is that the largest cloud platforms have become something of a hybrid business model that is part software platform, part digital infrastructure network, part capital-intensive industrial system. Our hypothetical “average hyperscaler” scenario analysis provides just a few directions this hybrid business model could go in terms of returns on invested capital. In the consensus-driven base case, that hybrid can still earn attractive returns, with revenue growth strong enough to absorb the current investment wave. In the upside case, capital efficiency improves fast enough that the business begins to look increasingly software-like, with operating margins above 40% and ROIC moving into the 20%+ range.
But the downside scenarios highlight why the burden of proof has risen. If demand merely underwhelms, returns can fall toward infrastructure-like levels even while revenue continues to grow. If demand disappoints while fixed costs, depreciation, and commitments remain elevated, the economics can deteriorate quickly, with useful assets earning sub-cost-of-capital returns.
The conclusion is therefore balanced but disciplined. Hyperscaler cloud businesses may deserve a premium valuation to traditional infrastructure, but it should no longer be analyzed as pure software. The right framework is ROIC-driven: how much capital is being deployed, how quickly is that capital monetized, and whether the incremental dollar of AI infrastructure earns platform-like returns or infrastructure-like returns.
Asset Allocation Insights
The LPL Research Strategic and Tactical Asset Allocation Committee (STAAC) maintains its recommendation for a tactical equity overweight and fixed income underweight. While maintaining our equity and U.S. equity overweights, the Committee favors neutral style exposure because of stretched market positioning and technical indicators following the recent growth-led rally. As such, this view is expressed via a defensive factor tilt given our expectation for bouts of volatility until the macro backdrop begins to improve as the Iran conflict eventually plays out to a resolution, allowing markets to refocus on a broadly healthy fundamental landscape.
Within equity sectors, we hold an overweight stance toward the energy sector due to logistical challenges surrounding normalizing global oil flows. The STAAC places value on this hedge against potential extended Mideast shipping disruptions. The Committee also recommends an overweight to industrials, supported by strong earnings momentum, favorable technicals, and continued tailwinds from fiscal spending and AI investment. In fixed income, the Committee maintains a neutral stance on duration relative to benchmarks. Our tactical views emphasize a continued focus on quality bond sectors, caution in rate‑sensitive fixed income sectors, and an ongoing allocation to diversifying strategies and alternatives.
Tom Shipp, Head of Equity Research, LPL Financial
Important Disclosures
This material is for general information only and is not intended to provide specific advice or recommendations for any individual. There is no assurance that the views or strategies discussed are suitable for all investors or will yield positive outcomes. Investing involves risks including possible loss of principal. Any economic forecasts set forth may not develop as predicted and are subject to change.
References to markets, asset classes, and sectors are generally regarding the corresponding market index. Indexes are unmanaged statistical composites and cannot be invested into directly. Index performance is not indicative of the performance of any investment and do not reflect fees, expenses, or sales charges. All performance referenced is historical and is no guarantee of future results.
Any company names noted herein are for educational purposes only and not an indication of trading intent or a solicitation of their products or services. LPL Financial doesn’t provide research on individual equities.
All information is believed to be from reliable sources; however, LPL Financial makes no representation as to its completeness or accuracy.
All investing involves risk, including possible loss of principal.
US Treasuries may be considered “safe haven” investments but do carry some degree of risk including interest rate, credit, and market risk. Bonds are subject to market and interest rate risk if sold prior to maturity. Bond values will decline as interest rates rise and bonds are subject to availability and change in price.
The Standard & Poor’s 500 Index (S&P500) is a capitalization-weighted index of 500 stocks designed to measure performance of the broad domestic economy through changes in the aggregate market value of 500 stocks representing all major industries.
The PE ratio (price-to-earnings ratio) is a measure of the price paid for a share relative to the annual net income or profit earned by the firm per share. It is a financial ratio used for valuation: a higher PE ratio means that investors are paying more for each unit of net income, so the stock is more expensive compared to one with lower PE ratio.
Earnings per share (EPS) is the portion of a company’s profit allocated to each outstanding share of common stock. EPS serves as an indicator of a company’s profitability. Earnings per share is generally considered to be the single most important variable in determining a share’s price. It is also a major component used to calculate the price-to-earnings valuation ratio.
All index data from FactSet or Bloomberg. All index data from FactSet or Bloomberg.
This research material has been prepared by LPL Financial LLC.
Not Insured by FDIC/NCUA or Any Other Government Agency | Not Bank/Credit Union Guaranteed | Not Bank/Credit Union Deposits or Obligations| May Lose Value
For public use.
Member FINRA/SIPC.
RES-0007122-0526 | For Public Use | Tracking #1146664 (Exp. 07/2027)
Source





Weekly Market Commentary | Can Hyperscalers’ AI Ambitions Add Up? | July 27, 2026
Printer Friendly Version
Can Hyperscalers Earn Their AI Ambitions?
LPL Research explores whether hyperscalers can generate attractive returns on massive AI investments through a framework focused on ROIC, growth, and capex.
Market context: The first half of 2026 was a tale of two quarters for U.S. equity markets, as the S&P 500 experienced a drawdown of ~4.5% in the first quarter, followed by a ~15% rally in the second quarter. As investors look forward to the second half, the artificial intelligence (AI) trade remains top of mind, much as it has over the last three-plus years.
The capex spotlight: With second quarter (Q2) earnings season well underway, attention is laser-focused on capital expenditure (capex) spending signals from the cloud computing “hyperscalers” driving the majority of spend.
A framework for ROIC: Here, we take a data-driven approach to help frame the debate on the return on invested capital (ROIC) on hyperscaler AI capex, using various scenarios for a hypothetical “average hyperscaler.” We then compare those return profiles to similar return generating businesses, with the end goal being a clear-minded approach to thinking about the hyperscaler business model for long-term investors.
What Does Hyperscaler Capex Have to Earn?
The AI investment cycle has become one of the defining capital allocation questions in public markets. The largest technology companies are spending at a scale that would have seemed implausible only a few years ago. The scale and expected growth of this spending is presented in Exhibit 1, “Historical and Forward Capex Expectations (Consensus).” The market has largely rewarded that spending because the near-term signals imply that cloud growth is accelerating and AI demand is supply constrained.
Exhibit 1: Historical and Forward Capex Expectations (Consensus)
Source: LPL Research, Company Reports, Bloomberg 07/23/26
Disclosures: Past performance is no guarantee of future results. GOOGL 2026 estimate is midpoint of company guidance; MSFT and ORCL data has been converted to calendar year convention.
For investors, the question is not how much capital is being deployed, but whether that capital will earn attractive returns over the life of the assets being built. Rather than make a bullish or bearish call attempting to answer this question, we can build a framework around the three major public hyperscaler cloud businesses (Amazon Web Services, Microsoft Azure, and Google Cloud) to ascertain what an “average hyperscaler cloud business” has to earn on its capital for today’s investment cycle to make sense. Note, we do not include Meta Platforms or Oracle Corp. (ORCL) in our framework, as these companies’ external cloud businesses are not mature enough to provide reliable historical data in our aggregate “average hyperscaler” build.
This discussion, as noted in the latest Beyond the Numbers, focuses primarily on ROIC that a hyperscaler cloud business generates. As a corporate finance refresher, ROIC measures how effectively a company converts the capital invested in the business (both debt and equity) into operating profit. The simple rule is that investments earning ROIC above a company’s weighted-average cost of capital (WACC) create economic value, while investments earning ROIC below WACC destroy value and should generally not be pursued unless there is a credible path to higher future returns or a strategic reason that justifies the near-term value destruction.
The Economics of the “Average Hyperscaler Cloud Business”
To understand the “average hyperscaler,” we must construct a hypothetical aggregate of the cloud computing infrastructure business segments of the three major hyperscalers previously outlined, with some necessary adjustments due to reporting nuances. These segments are just single business lines within larger businesses, and we recognize that each are at slightly different levels of maturity and their revenue is not wholly generated from “AI-compute.” However, much of the traditional non-AI cloud business infrastructure is deeply integrated into the segment’s AI-compute capability that is being heavily invested in today. Thus, we take a best-effort approach to isolate what matters to create an “average hyperscaler” business. Our build begins with calendar year-end 2025 as our baseline, and we define the core building blocks below.
From Software Multiples to Infrastructure Math
Our calendar 2025 starting point shows these are very large, very profitable businesses. AWS reported roughly $129 billion for 2025, and Google Cloud reported ~$59 billion for 2025. Microsoft does not disclose Azure revenue directly, but the Intelligent Cloud segment generated ~$120 billion in revenue in calendar 2025. Based on company disclosures and our math, we believe the Azure and other cloud services sub-segment was a ~$90B revenue business, representing roughly 75% of the reported Intelligent Cloud segment. Across the three, cloud infrastructure market share remains concentrated, with AWS, Azure, and Google Cloud estimated at roughly 31%, 24%, and 12% of the global market, respectively, per industry research.
The segment margin story has also improved materially. AWS generated $14.2 billion of operating income in Q1 2026, implying a 37.7% operating margin. Google Cloud’s margin progression has been especially notable, moving from low-single-digit profitability earlier in the cycle to reported margins in the mid-20s to 32% in Q1 2026, though the reported calculation does not include shared AI R&D reported at the corporate level. Microsoft’s Intelligent Cloud segment has historically operated at even higher margins, though it includes more than Azure alone.
The complication is capex. Amazon, Microsoft, and Alphabet collectively spent more than $300 billion on capex at the corporate level in calendar 2025, with anywhere from 60–75% of that total dedicated to AI compute and data center buildouts. The numbers are clearly rising again in 2026, with outside estimates pointing to very large increases across all three companies. By our estimates, combined cloud capex as a percentage of cloud-specific revenue approached the 75–80% range for the three hyperscalers in calendar 2025. These capex-to-sales levels are more commonly associated with infrastructure-heavy industries than traditional software platforms.
The hyperscaler’s cloud businesses still generate software-like margins, but the incremental investment profile increasingly looks infrastructure-like. Therefore, the relevant question becomes should this business be valued like a software platform, infrastructure asset, or something in between?
The Business Drivers That Decide the Return
A useful way to think about the return math is to build a composite cloud ROIC using the previously defined building blocks of our aggregated “average hyperscaler cloud business.” The numerator is relatively straightforward: cloud segment operating income, tax-adjusted into an estimate of net operating profit after tax (NOPAT). The denominator, invested capital, is the “deployed infrastructure asset” base, which includes estimated net PP&E and operating lease ROU assets utilized in the hyperscaler cloud business. Two additional drivers that are particularly important are capital expenditures (which are added to the deployed infrastructure capital asset base as gross PP&E) and depreciation of the capital asset base (which is reported as an operating expense over time, reducing operating income, and is recorded on the balance sheet as accumulated depreciation, thus reducing PP&E over time). Effectively, capex does not immediately reduce operating income dollar-for-dollar. Our approach takes the estimated useful life of the incremental PP&E assets into account, where much of the chips/server equipment has a shorter useful life (and thus larger annual depreciation hit over a shorter period), while buildings and land assets have a longer useful life.
Scenario Analysis: What Has to Be True?
In order to derive a baseline market consensus read on what these returns are currently estimated to be, we first build a calendar year 2025–2030 ROIC composite that aggregates consensus estimates for the core drivers of each cloud business, with necessary adjustments previously outlined. Once we have this baseline, we can create several scenarios that shift the core drivers of ROIC up or down, based on the specific scenario we are modeling. Our scenario analysis included four hypothetical futures over this time: scenario one reflects the consensus baseline; scenario two reflects a more bullish scenario than the consensus baseline that assumes the same revenue growth as scenario one with capital efficiency realizations resulting in lower capex; scenario three reflects a slightly bearish but perhaps more realistic scenario with slower revenue and capex growth; and scenario four reflects a downright bearish scenario with even slower revenue growth without declines in capex. The variation of each scenario’s average 2028–2030 ROIC output, alongside the implied revenue CAGR (compound annual growth rate), can be found in Exhibit 2 “Summary of Hyperscaler ROIC Scenario Analysis.” Please note these are hypothetical scenarios only and not indicative of any particular company, security, or investment. The hypothetical average hyperscaler is a modeled construct developed by LPL Research and does not represent an actual company or investable entity.
Exhibit 2: Summary of Hyperscaler ROIC Scenario Analysis
Source: LPL Research, Company Reports, Bloomberg 07/23/26
Disclosures: Past performance is no guarantee of future results. Hypothetical example for illustrative purposes only. The hypothetical average hyperscaler is a modeled construct developed by LPL Research and does not represent an actual company or investable entity.
Across all four cases, the hypothetical average hyperscaler remains a large and strategically important business; what changes is the appropriate comparable industry and valuation framework as growth, margins, capital intensity, depreciation burden, and ROIC move through the cycle. In upside cases, the business retains enough platform economics to justify a premium to traditional infrastructure, and in the strongest case, begins to resemble software-like infrastructure. In the downside cases, however, the valuation lens shifts materially: first toward high-quality data center/telecom infrastructure, and then, in the most adverse outcome, toward an asset-heavy overbuild framework where replacement value, normalized free cash flow, balance sheet flexibility, and cost of capital matter more than revenue growth alone.
Conclusion
The hyperscaler AI capex cycle is not easily classified as either a bubble or a straightforward software growth story. The more useful framing is that the largest cloud platforms have become something of a hybrid business model that is part software platform, part digital infrastructure network, part capital-intensive industrial system. Our hypothetical “average hyperscaler” scenario analysis provides just a few directions this hybrid business model could go in terms of returns on invested capital. In the consensus-driven base case, that hybrid can still earn attractive returns, with revenue growth strong enough to absorb the current investment wave. In the upside case, capital efficiency improves fast enough that the business begins to look increasingly software-like, with operating margins above 40% and ROIC moving into the 20%+ range.
But the downside scenarios highlight why the burden of proof has risen. If demand merely underwhelms, returns can fall toward infrastructure-like levels even while revenue continues to grow. If demand disappoints while fixed costs, depreciation, and commitments remain elevated, the economics can deteriorate quickly, with useful assets earning sub-cost-of-capital returns.
The conclusion is therefore balanced but disciplined. Hyperscaler cloud businesses may deserve a premium valuation to traditional infrastructure, but it should no longer be analyzed as pure software. The right framework is ROIC-driven: how much capital is being deployed, how quickly is that capital monetized, and whether the incremental dollar of AI infrastructure earns platform-like returns or infrastructure-like returns.
Asset Allocation Insights
The LPL Research Strategic and Tactical Asset Allocation Committee (STAAC) maintains its recommendation for a tactical equity overweight and fixed income underweight. While maintaining our equity and U.S. equity overweights, the Committee favors neutral style exposure because of stretched market positioning and technical indicators following the recent growth-led rally. As such, this view is expressed via a defensive factor tilt given our expectation for bouts of volatility until the macro backdrop begins to improve as the Iran conflict eventually plays out to a resolution, allowing markets to refocus on a broadly healthy fundamental landscape.
Within equity sectors, we hold an overweight stance toward the energy sector due to logistical challenges surrounding normalizing global oil flows. The STAAC places value on this hedge against potential extended Mideast shipping disruptions. The Committee also recommends an overweight to industrials, supported by strong earnings momentum, favorable technicals, and continued tailwinds from fiscal spending and AI investment. In fixed income, the Committee maintains a neutral stance on duration relative to benchmarks. Our tactical views emphasize a continued focus on quality bond sectors, caution in rate‑sensitive fixed income sectors, and an ongoing allocation to diversifying strategies and alternatives.
Tom Shipp, Head of Equity Research, LPL Financial
Important Disclosures
This material is for general information only and is not intended to provide specific advice or recommendations for any individual. There is no assurance that the views or strategies discussed are suitable for all investors or will yield positive outcomes. Investing involves risks including possible loss of principal. Any economic forecasts set forth may not develop as predicted and are subject to change.
References to markets, asset classes, and sectors are generally regarding the corresponding market index. Indexes are unmanaged statistical composites and cannot be invested into directly. Index performance is not indicative of the performance of any investment and do not reflect fees, expenses, or sales charges. All performance referenced is historical and is no guarantee of future results.
Any company names noted herein are for educational purposes only and not an indication of trading intent or a solicitation of their products or services. LPL Financial doesn’t provide research on individual equities.
All information is believed to be from reliable sources; however, LPL Financial makes no representation as to its completeness or accuracy.
All investing involves risk, including possible loss of principal.
US Treasuries may be considered “safe haven” investments but do carry some degree of risk including interest rate, credit, and market risk. Bonds are subject to market and interest rate risk if sold prior to maturity. Bond values will decline as interest rates rise and bonds are subject to availability and change in price.
The Standard & Poor’s 500 Index (S&P500) is a capitalization-weighted index of 500 stocks designed to measure performance of the broad domestic economy through changes in the aggregate market value of 500 stocks representing all major industries.
The PE ratio (price-to-earnings ratio) is a measure of the price paid for a share relative to the annual net income or profit earned by the firm per share. It is a financial ratio used for valuation: a higher PE ratio means that investors are paying more for each unit of net income, so the stock is more expensive compared to one with lower PE ratio.
Earnings per share (EPS) is the portion of a company’s profit allocated to each outstanding share of common stock. EPS serves as an indicator of a company’s profitability. Earnings per share is generally considered to be the single most important variable in determining a share’s price. It is also a major component used to calculate the price-to-earnings valuation ratio.
All index data from FactSet or Bloomberg. All index data from FactSet or Bloomberg.
This research material has been prepared by LPL Financial LLC.
Not Insured by FDIC/NCUA or Any Other Government Agency | Not Bank/Credit Union Guaranteed | Not Bank/Credit Union Deposits or Obligations| May Lose Value
For public use.
Member FINRA/SIPC.
RES-0007122-0526 | For Public Use | Tracking #1146664 (Exp. 07/2027)
Source